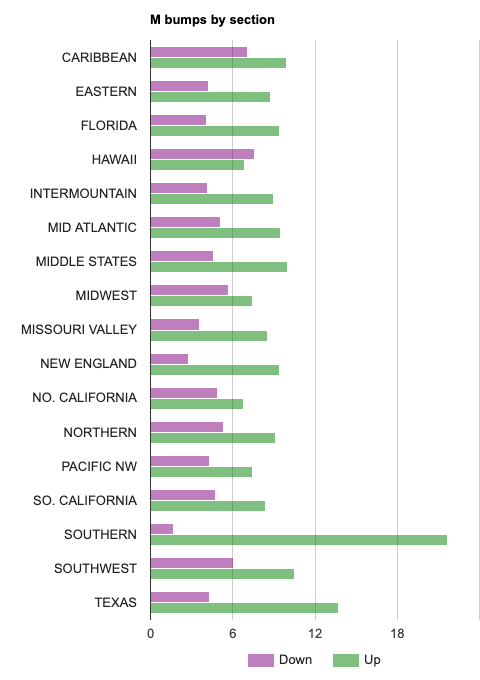
Bumps by section 2020.

J011yroger

Talk Tennis Guru
Eastern seems pretty normal, few surprises but no more than usual.

Sounds like Southern and Mid Atlantic got pulverized.

Texas and SoCal got stung a bit?

Report for your section.

J
 

BallBag

Professional
All the 4.0s in my section got bumped. Its just me and Steve in 4.0 and I think Steve auto appealed back down to 4.0.
 

schmke

Legend
Not by section yet, but just posted updated bump stats by level nationally. Definitely more bump ups than past years, especially at 4.0 and 4.5.

The past 3 years, 4.3-4.8% of 4.0s were bumped up, this year, 7.2%.

For 4.5s, it was 3.6-4.4% the past 3 years, and this year, 5.0%.
 

J011yroger

Talk Tennis Guru
Not by section yet, but just posted updated bump stats by level nationally. Definitely more bump ups than past years, especially at 4.0 and 4.5.

The past 3 years, 4.3-4.8% of 4.0s were bumped up, this year, 7.2%.

For 4.5s, it was 3.6-4.4% the past 3 years, and this year, 5.0%.

I have a feeling the distribution is uneven.

J
 

schmke

Legend
I have a feeling the distribution is uneven.

J
Oh, it always is. I just start nationally and then drill down. But my point was if nationally the 4.0 bump up rate went from <5% to >7%, that uneven distribution may be pretty high in places like we are seeing anecdotal evidence of.
 

trey.luby

New User
Oh, it always is. I just start nationally and then drill down. But my point was if nationally the 4.0 bump up rate went from <5% to >7%, that uneven distribution may be pretty high in places like we are seeing anecdotal evidence of.
Probably some interesting numbers based on 18's vs 40's as well.
 

J_R_B

Hall of Fame
Middle States 4.0 has a TON in NJ district. Philadelphia district seems pretty typical except the team that won sectionals had 11 (a lot were appealed players who were bumped back up, though).

Middle States 4.5 seems pretty normal.
 

brettatk

Semi-Pro
Looks like we had about 150 guys bumped from 4.0 to 4.5 here in Atlanta. Looks like 56 were bumped from 4.5 to 5.0. So that's 13% bumped up for both 4.0 to 4.5 and 4.5 to 5.0.
 
Last edited:

Deanm85

New User
Lots of bump ups from 4.5 to 5.0 in Texas - at least anecdotally. I got bumped back down to 4.5 which is nice since I got bumped up a couple years ago just days after shredding my ACL. The only 2 players bumped to 5.0 that I have corresponded with were each able to successfully appeal down. I've seen other bump downs since scanning this morning but impossible to know how many denied appeals there have been.
 

boilerfan

New User
our area in NC had 39 out of 117 4.0's bumped up(33%). 15 out of 95 4.5's were bumped up(15%). The neighboring areas were similar, but didn't seem as badly hit for 4.0's. Some really weird 4.0 bumpups also.
 

kevrol

Hall of Fame
Put this in another thread but thought would post here as well. This is my local area in Southern.

Breakdown of the number by gender and level.

Nothing very surprising on the ladies' side.

Female% just bumped up% just bumped down
3.010.0%5.63%
3.55.49%5.27%
4.05.21%2.43%
4.55.131.28

But look at the men.

Male% just bumped up% just bumped down
3.08.5%3.1%
3.514.4%1.8%
4.016.9%7.3%
4.528.0%0.0%


Moveforwardalways

Hall of Fame
for sure, I saw a local player self-rated this year, went 0/3 in 4.5 40's league and got bumped to 5.0, never won a set and of the 6 sets one was 6/4 that was the closest

I haven't seen one quite that unusual, but I have seen a few close. I think they are trying to expand playing options at the higher end of the scale. Although, I do not know that this increases the overall numbers, as there have been bump downs as well. There have been a few that had to be administrative overrides too. I know TR and TLS are not perfect but they shouldn't be missing by an entire 0.35-0.4 range.
 

TagUrIt

Hall of Fame
I’ve had three different people text me to tell me I got bumped to 4.0. Does anyone have a link for this list?
 

schmke

Legend
I just posted my bump rates by section on my blog, including overall and by gender. Southern and Texas did lead the way overall with bump ups, but for the men did have an abnormally high rate of bump ups, one of the few times the rate is over 20%. Texas was higher than others as well at 14%. Anyone else can feel free to post a link to the full post, but here is the image for the men.

2019-bump-by-section-m.png
 

denoted

Semi-Pro
Anecdotally I know of several people in Southern who played at 3.5 but were obviously (eye-test and results) way past that.
 

denoted

Semi-Pro
Anecdotally I know of several people in Southern who played at 3.5 but were obviously (eye-test and results) way past that.

For example, 3/4 of the Southern Section's winning 3.5 18+ team (men's) was bumped to 4.0. Maybe that's typical?
 
Here's the link. Southern men and Texas men were specifically targeted. I almost want this to be it's own thread. Any speculation why?
I speculated that there could be a readjustment coming in Southern Section. This is mainly because our bell curve was out of whack compared to the other sections. This is from another thread:
@schmke do you have any inkling that a redistribution might happen? Reason I ask is because of the ratings distributions per section, as TR has shown here : TRecords
For men’s ratings, most sections have about an equal amount of 3.5s and 4.0s with about half that amount of 4.5s. In Southern, we have over 11,000 3.5s, 8,400 4.0s, and then 2,800 4.5s.
Are we just eating too much BBQ and fried foods to normalize those numbers with the rest of the nation?
 

taydbear7

Professional
I'm in the Southern region and there's speculation that because the Southern region did so well in Sectionals they bumped a lot of people.
 

Moveforwardalways

Hall of Fame
I speculated that there could be a readjustment coming in Southern Section. This is mainly because our bell curve was out of whack compared to the other sections. This is from another thread:

Very interesting. Thanks for posting those numbers. Does this mean there was more sandbagging in the Southern mens sections? If so, wouldn't that be evident at nationals with southern taking more titles?
 

J_R_B

Hall of Fame
Here's the link. Southern men and Texas men were specifically targeted. I almost want this to be it's own thread. Any speculation why?
Well, in TX, everyone's favorite cheater had a 3.5 team that could have competed at 4.5 nationals. So there's that...
 

ShaunS

Semi-Pro
For example, 3/4 of the Southern Section's winning 3.5 18+ team (men's) was bumped to 4.0. Maybe that's typical?
It's pretty common for teams that do well, on a national scale, to get more aggressively bumped.

Very interesting. Thanks for posting those numbers. Does this mean there was more sandbagging in the Southern mens sections?
The large scale adjustments aren't necessarily meant to correct for cheating. Before I go any further, I haven't looked at the numbers, but I'll take their supposition that the distribution didn't match the national curve to be true. Combine that with solid showings at national events, and the USTA may've felt it safe to make more aggressive adjustments to try and align the numbers with the other regions.

Again, working off very little actual data, I'm wondering if the increased bumps across the country is part of a concerted effort to slightly redefine the ratings. It doesn't seem like too crazy of an idea to shave off 4.0s top a bit if they are concerned about 4.5 participation levels.
 
Very interesting. Thanks for posting those numbers. Does this mean there was more sandbagging in the Southern mens sections? If so, wouldn't that be evident at nationals with southern taking more titles?
Southern section is so big that it looks shocking when you see the amounts of people at each level. It just seemed to me that they were due to shift some of the middle of that janky bell curve towards 4.5 and 5.0. Plus, we keep on seeing the exact same guys at the state tournament and at least at 4.0 level in SC. I think we haven’t sent a team to sectionals in a couple of years, so as a result we were avoiding playing the best of the best and stayed insulated from the little readjustments that trickle down from nationals and sectionals.
 

iNeverSlice

Rookie
Is there any way to see all the bump-ups and bump-downs or do you just have to search everyone individually to see if they got bumped?
 

kevrol

Hall of Fame
Is there any way to see all the bump-ups and bump-downs or do you just have to search everyone individually to see if they got bumped?
Unless you have a before and after list there's no way for you to tell. I always download everyone in my area around mid november. That way when new ratings are out it takes all of about 2 minutes in excel to see who was bumped and who wasn't.
 

schmke

Legend
It's pretty common for teams that do well, on a national scale, to get more aggressively bumped.


The large scale adjustments aren't necessarily meant to correct for cheating. Before I go any further, I haven't looked at the numbers, but I'll take their supposition that the distribution didn't match the national curve to be true. Combine that with solid showings at national events, and the USTA may've felt it safe to make more aggressive adjustments to try and align the numbers with the other regions.

Again, working off very little actual data, I'm wondering if the increased bumps across the country is part of a concerted effort to slightly redefine the ratings. It doesn't seem like too crazy of an idea to shave off 4.0s top a bit if they are concerned about 4.5 participation levels.
Well, in theory, the year-end calculations that are done are meant to normalize things across the country, that has always been the case. I doubt the bumps this year that are in the chart I showed above are due solely to normal year-end calculations and some other adjustments were done to either compensate for what they thought were insufficient bumps from the normal calculations, or a desire to redistribute players among levels for presumably participation reasons.
 

kevrol

Hall of Fame
Lots of talk about Southern being adjusted because of their showings at Nationals. Southern has 29% of league players. Southern should dominate compared to other sections. The next closest section is Mid West with 9.5%.

Anyone know why ******* is filtered?
 

iNeverSlice

Rookie
Unless you have a before and after list there's no way for you to tell. I always download everyone in my area around mid november. That way when new ratings are out it takes all of about 2 minutes in excel to see who was bumped and who wasn't.
Where do you get a master list from? I'd be happy to look at a new one and figure out the bumps just by looking.
 

brettatk

Semi-Pro
Where do you get a master list from? I'd be happy to look at a new one and figure out the bumps just by looking.

Look in tennislink. Once you are there click on the first tab (USTA LEAGUE) and under FIND USTA RATING INFO click on "Advanced Search". Then choose year, section, district, and Area. You can also choose male/female or a specific level. After you display the names you have to copy and paste them into Excel. I also have a baseline that I downloaded prior to today. After setting up some formulas I can now copy and paste the info in and see how many appeals were granted. Not so many thus far. I wish there was a way you could see if an appeal was denied.
 
Is there any way to see all the bump-ups and bump-downs or do you just have to search everyone individually to see if they got bumped?
This is a bit tedious but this is what I have done. Someone else probably has a better way.

-Go to tennislink.usta.com
-Hover over the USTA tab
-Click on advanced search under “FIND NTRP RATING INFO”
-Select the section, district, and area name you want to see
*If you want to see the whole list at particular rating, leave league name as is and then select the gender and level you want to see
**If you just want to see the bump-ups, select a league, then the name of the flight, and then a rating that is one level higher than the league you selected.

For example, to see 4.5 to 5.0 bumps;
-Select 18 and over in the league name drop down
-Select 18 and over (Men or Women) 4.5 in the flight name drop down
-Then select 5.0 in the level drop down

Flight name tends to be different for most associations but you get the general idea.
 

ShaunS

Semi-Pro
Lots of talk about Southern being adjusted because of their showings at Nationals. Southern has 29% of league players. Southern should dominate compared to other sections. The next closest section is Mid West with 9.5%.

Anyone know why ******* is filtered?
Well, I presume it's censored because it's part of a competitor's name... a wildly overzealous bit of censorship.

As far as the logic that Southern would dominate because it has more people, that doesn't really play out in reality. We're working within the confines of talent groupings. Sure, the larger number could help to have "deeper" teams. The teams playing at nationals aren't simply taking the top 15 players out of thousands, so even that really doesn't pan out.

Edit: One note about the TennisLink Advanced Search. I used that earlier today, and I noticed a couple people weren't showing up. When I go to them specifically, it does show them in the area, so I'm not sure why they weren't coming up. Just something to keep in mind if you don't see everyone.
 

brettatk

Semi-Pro
Also in Advanced Search it gives you options for previous years but it doesn't work. It'll show up to date ratings no matter what year you choose. That's why you had to have downloaded something prior so you have something to compare it to.
 

schmke

Legend
As far as the logic that Southern would dominate because it has more people, that doesn't really play out in reality. We're working within the confines of talent groupings. Sure, the larger number could help to have "deeper" teams. The teams playing at nationals aren't simply taking the top 15 players out of thousands, so even that really doesn't pan out.
This is correct. Having a larger population to pull from gives an advantage to a point, but unless super teams are being formed from across the section, it is really the pool of players in a given city and perhaps nearby areas that matters. We regular see teams from mid-size cities making it to Nationals and they predominantly (usually entirely) have players from their city, so any other city of similar size with a similar player pool should have as good a shot at advancing.

Now, an advantage Southern does have is that because there are a lot of players, both in league, but especially in local playoffs, Districts/States, and Sectionals, teams play more matches than many other sections once they get to Nationals and so they are battle tested so to speak.
 

kevrol

Hall of Fame
Understand the point y'all are making that there are 18 sections so every nationals participant has a roughly 1/18 chance of winning nationals. However as schmke pointed out Southern teams are probably more battle tested. Also in general it's gonna be a lot tougher to win the Southern section with its almost 80,000 players than it is to win Northern with roughly 3,500. If you take those 2 extremes I'd be willing to guess the Southern champ would win 2/3 of the time at each level. So while sheer numbers don't necessarily mean a better team, it certainly doesn't hurt. I don't have anything to base that 2/3 on other than a W.A.G. so please don't ask me to defend that number. LOL

Now, an advantage Southern does have is that because there are a lot of players, both in league, but especially in local playoffs, Districts/States, and Sectionals, teams play more matches than many other sections once they get to Nationals and so they are battle tested so to speak.
 
Last edited:

Moveforwardalways

Hall of Fame
Undestand the point y'all are making that there are 18 sections so every nationals participant has a roughly 1/18 chance of winning nationals. However as schmke pointed out Southern teams are probably more battle tested. Also in general it's gonna be a lot tougher to win the Southern section with its almost 80,000 players than it is to win Northern with roughly 3,500. If you take those 2 extremes I'd be willing to guess the Southern champ would win 2/3 of the time at each level. So while sheer numbers don't necessarily mean a better team, it certainly doesn't hurt. I don't have anything to base that 2/3 on other than a W.A.G. so please don't ask me to defend that number. LOL

Interestingly, despite all that, Southern does not win a statistically disproportionate number of championships.
 

Moveforwardalways

Hall of Fame
So will TLS and TR let their year end ratings stand or adjust them? They are off by quite a bit for many in the southern section. Seen more than a few guys with 3.8 ish ratings that are now USTA 4.5's who cannot appeal down.
 

schmke

Legend
Interestingly, despite all that, Southern does not win a statistically disproportionate number of championships.
Correct. My hypothesis is that being bigger has diminishing returns. Compared with a section like Northern, yes, all that Southern has to offer from the larger pool of players to being more tested will result in Southern beating Northern at Nationals the majority of the time. But other sections like Eastern Mid-Atlantic, Middle States, Middlewest, Texas, SoCal, NorCal, Florida, and PNW are all large enough that given how teams are formed locally, can compete with Southern toe to toe in most years.
 

kevrol

Hall of Fame
Interestingly, despite all that, Southern does not win a statistically disproportionate number of championships.
Been awhile since I took college statistics but if I remember correctly it would be really hard prove anything statistically given the limited number of events at nationals.

This isn't a hill I'm planning on dying on. Just think it's fun to comment and throw out numbers. I will say I looked at all the In 18+ and 40+ winners this year (Adult & Mixed) and out of 28 events Southern won 5 (tied for the most with Texas). No other section won more than 2. Northern won 0. Doesn't prove anything statistically but seems to suggest, to me at least, a team from Southern has better odds to win Nationals than a team from Northern.
 

Moveforwardalways

Hall of Fame
There is a rumor circulating that Southern decided to count/calculate ratings for more than just the spring adult league and factored them in. They were trying to see who was sandbagging in spring to play out in combo, singles, etc. Not sure if that is true or not, but some are saying that explains some of the unusual bump ups.
 
Top